Check Memory Usage in Linux – System administrators must ensure that a Linux system always operates at optimal levels. You can use a few simple terminal commands to access all relevant information and monitor memory statistics on your server.
Table of Contents
Check Memory Usage in Linux via Command Line
Checking Linux memory usage via the command line is a highly efficient method and often the only way to check memory usage on remote headless servers.
Use the examples below to check memory usage via SSH
vmstat Command
The vmstat command reports virtual memory statistics. Type vmstat to get a snapshot of the system’s virtual memory statistics, including processes, memory, paging, block IO, traps, and CPU activity:
vmstat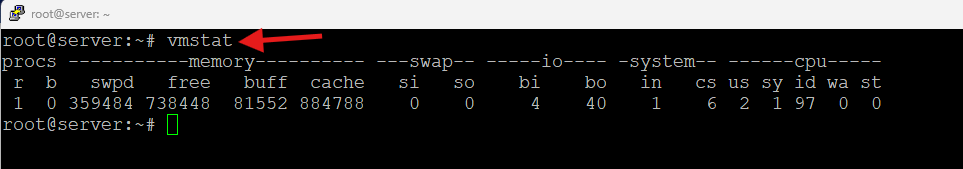
Use the following list to interpret the virtual memory statistics provided by vmstat.
Procs
- r – Number of processes waiting for run time.
- b – Number of processes in uninterruptible sleep.
Memory
- swpd – Amount of virtual memory used.
- free – Amount of idle memory.
- buff – Amount of memory used as buffers.
- cache – Amount of memory used as cache.
Swap
- si – Memory swapped in from disk (/s).
- so – Memory swapped to disk (/s).
IO
- bi – Blocks received from a block device (blocks/s).
- bo – Blocks sent to a block device (blocks/s).
System
- in – Number of interrupts per second, including the clock.
- cs – Number of context switches per second.
CPU
These values represent the percentage of total CPU time.
- us – Time spent running non-kernel code (user time, including nice time).
- sy – Time spent running kernel code (system time).
- id – Time spent idle. Before Linux 2.5.41, this includes IO-wait time.
- wa – Time spent waiting for IO. Before Linux 2.5.41, included in idle.
- st – Time stolen from a virtual machine. Before Linux 2.6.11, unknown.
Use the information from the fields to identify potential bottlenecks or areas that may require optimization.
top Command
The top command is essential for monitoring CPU and memory usage on a per-process basis. To launch it, enter top in the terminal :
topThe system displays information about:
- System uptime.
- Average load.
- Number of running tasks.
- Number of logged-in users.
- CPU utilization for each CPU or core.
- Memory and swap usage statistics for processes.
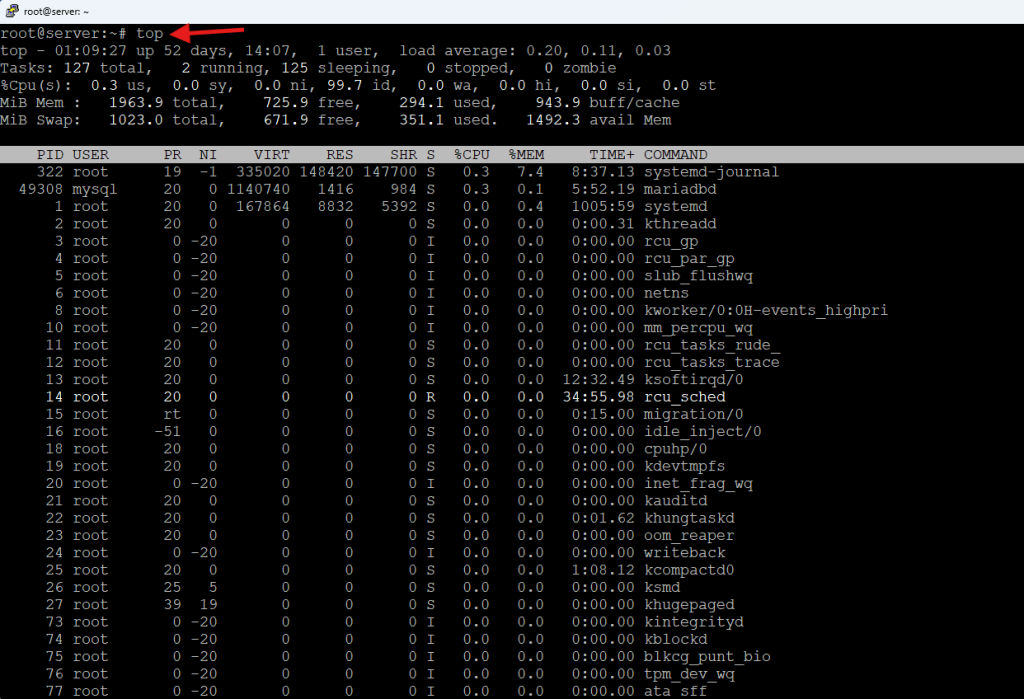
The data is continuously updated, which allows you to follow the process activity and system resources in real time.
In addition to providing essential memory information, the top command has an interactive interface that allows you to sort processes, change display settings, and manage operations without leaving the tool.
Press q to exit the interface.
htop Command
Like the top command, htop provides memory and CPU usage monitoring data but with several enhancements for a more user-friendly environment and improved controls.
It features color-coded output and allows full command lines for processes to be viewed. Additionally, htop supports vertical and horizontal scrolling for process lists.
To start htop, enter:
htop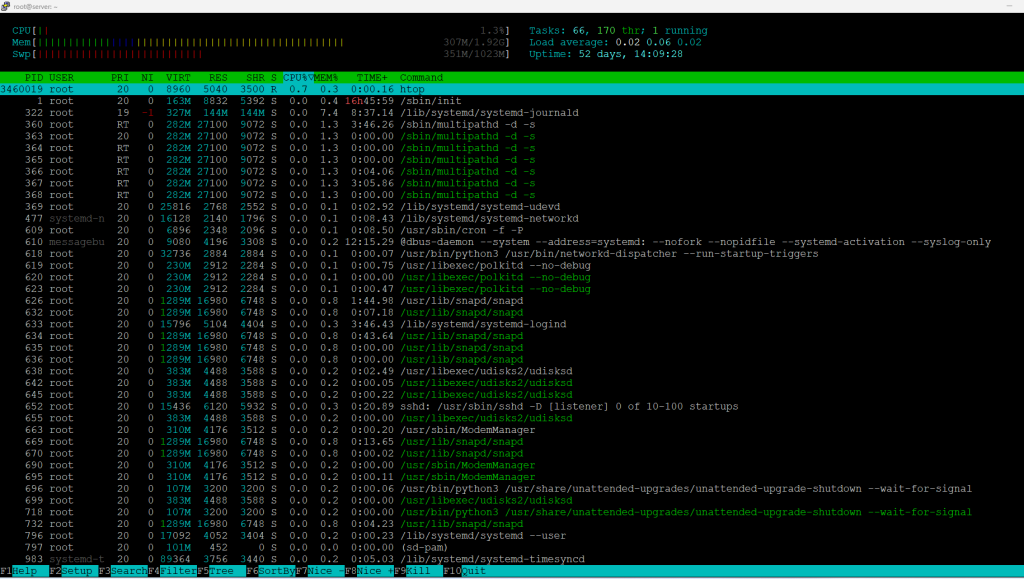
The output is divided into two main sections:
1. The top segment provides the summary and contains graphic meters and text counters.
2. The lower section structures the detailed data per process. This allows users to perform actions on individual processes.
The shortcuts at the bottom of the screen enable users to manipulate and customize the processes without typing commands.
cat Command
Use the cat command to open the /proc/meminfo file in your terminal:
cat /proc/meminfo/proc/meminfo is a virtual file that reports the amount of available and used memory. It contains real-time information about the system’s memory usage as well as buffers and shared memory used by the kernel.
This is an example of the /proc/meminfo file in Ubuntu 22.04:
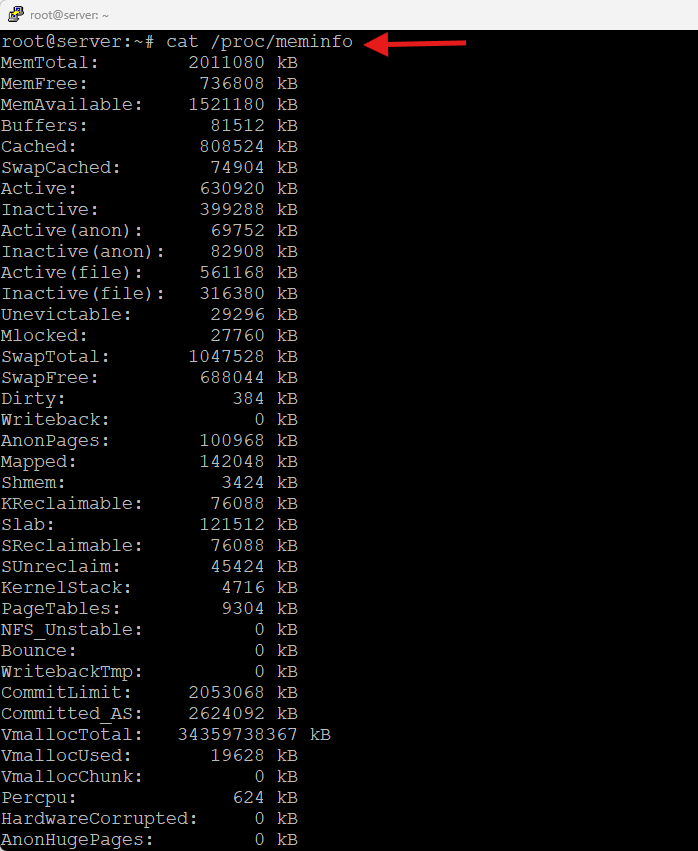
The values in the /proc/meminfo file are expressed in kibibytes.
free Command
The free command is used to monitor resource usage. It summarizes RAM and swap space usage, including total, used, free, shared, buff/cache, and available memory.
Type free in your terminal, without options, to display information about memory and swap, expressed in kibibytes:
free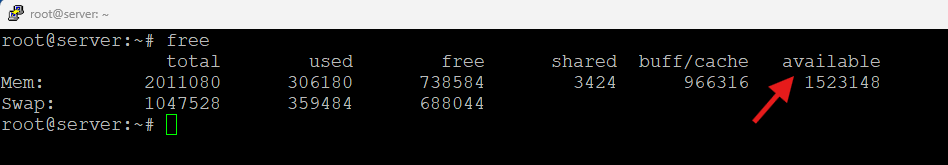
Here’s what each column represents:
| Column | Description |
|---|---|
| total | Total installed memory. |
| used | Memory currently in use (excluding buffers and cache). |
| free | Unused memory. |
| shared | Memory used by tmpfs and shared between processes. |
| buff/cache | The sum of buffer and cache memory, which are used by the operating system to speed up processes. |
| available | An estimation of how much memory is available for starting new applications, without swapping. |
The free command has multiple options that allow users to customize the output.
| Option | Result |
|---|---|
-b | Output in bytes. |
-k | Output in kibibytes. |
-m | Output in mebibytes. |
-g | Output in gibibytes. |
-l | Detailed low and high memory statistics. |
-o | Old format (no -/+buffers/cache line). |
-t | Total for RAM + swap. |
-s | Update every [delay] seconds. |
-c | Update [count] times. |
Use these options to adapt memory usage output to your needs.
sar Command
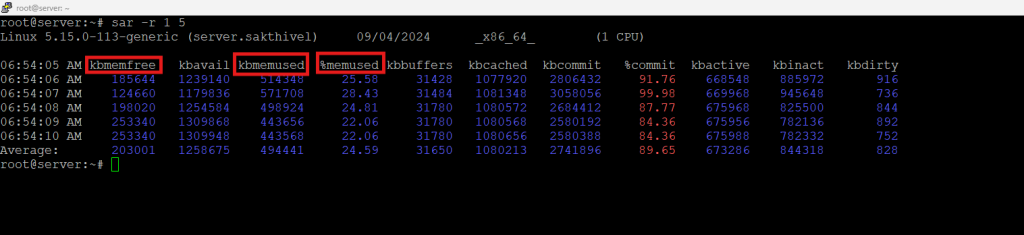
The sar tool is a utility for monitoring system performance. It is not limited strictly to memory usage, but you can use the -r option to track memory utilization statistics at regular intervals.
For example, enter the following command to direct sar to check memory usage statistics every second, five times in a row:
sar -r 1 5The metrics provide a detailed overview of your system’s memory utilization in several columns, including:
- kbmemfree – The amount of free memory in kilobytes.
- kbmemused – The amount of used memory in kilobytes.
- %memused – The percentage of used memory.
he sar utility is part of the sysstat package, which may not be pre-installed on some Linux distributions. Use the appropriate command to install the sysstat package:
| Linux Distribution | Command |
|---|---|
| Debian/Ubuntu | sudo apt install sysstat |
| RHEL 8+ and CentOS Stream | sudo dnf install sysstat |
| Fedora | sudo dnf install sysstat |
| Arch Linux | sudo pacman -S sysstat |
| openSUSE | sudo zypper install sysstat |